- Market Overview
- Futures
- Options
- Charts
- Custom Charts
- Spread Charts
- Market Heat Maps
- Historical Data
- Stocks
- Real-Time Markets
- Site Register
- Mobile Website
- Trading Calendar
- Futures 101
- Commodity Symbols
- Real-Time Quotes
- CME Resource Center
- Farmer's Almanac
- USDA Reports
The Saturday Spread: Using the Neglected Methodology That Wall Street Refuses to Teach

I’m going to be completely honest with you. I’ve always found options the way they’re traditionally taught to be utterly confusing — and dare I say irrational. So, I’ve never really bothered. I know the basic Greeks and even then, I’m a little shaky.
So, it raises the obvious question: if I’m not intimately familiar with the Greeks (and I’m not because I have to look them up to know what others are talking about), why do I write so much about options? The answer: my methodology, which is a discrete-event analysis based on the work of Russian mathematician Andrey Markov, seeks to overcome the epistemological flaws of traditional western methodologies.
I’m about to drop a truth bomb. It doesn’t matter how cheap implied volatility screeners indicate your debit-based strategy is or how much premium your credit-based strategy will give; if your target asset has a probabilistically low chance of success, then your entire trade carries an unacceptably high risk profile.
So, the question isn’t how cheap your options are. In my opinion, this is a useless statistic without appropriate context. Instead, traders should ask how likely a successful outcome is — and that’s where the ‘Russians,’ rather than the Greeks, provide additional clarity.
My system comprises of two Russian terms: Troitsa, which refers to the Holy Trinity of null hypothesis, alternative hypothesis and expected payoff and Proverka, an inspection or audit of the aforementioned predictive signal’s empirical viability. From these two concepts, we can utilize the principles of applied game theory to help guide our strategies.
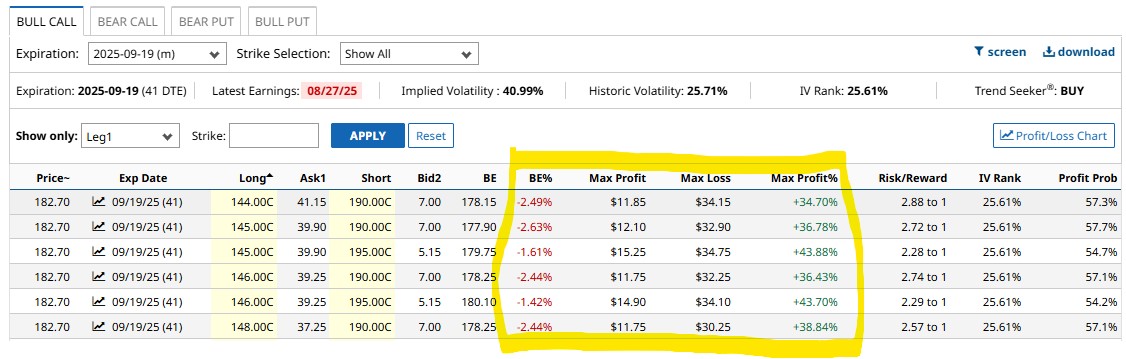
Even better, discrete-event analysis is very much compatible with the core features of Barchart Premier. In the below screenshot, I have circled the metrics (aside from the expiration date) that I utilize daily:
Contrary to popular misconception, you don’t really need a boatload of data to be an effective options trader. This is especially the case when you’re buying call spreads: you’re either going to break into the predefined profitability zone or you will not.
In that case, knowing the Greeks likely won’t help you. It all comes down to probabilities, which we’ll discuss next.
Eli Lilly (LLY)
Pharmaceutical giant Eli Lilly (LLY) has been in the news recently thanks to its massive drop. According to a CNBC headline, the volatility in LLY stock is tied to the underlying company’s obesity pill showing modest late-stage trial results. I know this is going to sound sacrilegious but for trading purposes, I don’t really care. I’m going to work off the reasonable presupposition that the market has already priced this and other developments into the security.
What we’re concerned with, then, is the sentiment voting record. In the past 10 weeks, the market voted to buy LLY stock six times and sell four times. During this period, LLY incurred a downward trajectory. For brevity, we can label this sequence as 6-4-D.
Since January 2019, the 6-4-D sequence has materialized 38 times on a rolling basis. It’s an unusual quantitative signal as the balance of accumulative sessions outweighs distributive, yet the security declined. This sets the stage for a potential reversal.
As a baseline, the chance that a long position in LLY stock will rise on any given week is 60%, an extremely strong upward bias. This is effectively our null hypothesis, the probabilistic performance expectation assuming no mispricing. However, our alternative hypothesis is that, because of the 6-4-D sequence, the chance of upside is actually 68.42%.
Assuming the positive pathway, the median expected return in the following week is 2.47%. If the bulls maintain control for the next three weeks, LLY stock could reach close to $655 based on past analogs.
To be upfront, running a one-tailed binomial test on the 6-4-D reveals a p-value of 0.1864. This means that there’s an 18.64% chance that the implications of the signal could materialize randomly as opposed to intentionally. Still, with the null hypothesis landing at 60%, I like my odds.
As an intriguing idea, take a look at the 640/650 bull call spread expiring Sep. 19.
Equinor (EQNR)
Next up is Norwegian multinational energy company, Equinor (EQNR). I’m not terribly familiar with this enterprise. Okay, I lied — I don’t know anything about it. What did attract me, though, was the volatility. EQNR stock has lost about 3% of value in the past five sessions. In the trailing month, the security dropped just over 7%. It could be a potential discount so long as we’re reading the probabilities correctly.
In the past 10 weeks, the market voted to buy EQNR stock four times and sell six times. During this period, EQNR enjoyed an upward trajectory. For brevity, we’ll label this sequence as 4-6-U. This is another unusual sequence as the balance of distributive sessions outweighs accumulative, yet the security has moved higher.
Since January 2019, this sequence has materialized 18 times. Notably, in 61.11% of cases, the flashing of the 4-6-U leads to upside in the following week, with a median return of 2.5%. Should the bulls maintain control for the next two weeks, the expected median performance is an additional 3.82%. With EQNR stock closing at $24.50 on Friday, it could be on pace to reach over $26.
What makes Equinor intriguing is that normally, the security suffers from a negative bias. In this case, the null hypothesis is only 48.7%. However, with the 4-6-U, the odds improve dramatically in our favor. Still, one should be cognizant of the signal’s p-value, which stands at a relatively lofty 0.2069.
Still, if you want to take a stab here, check out the 24/26 bull call spread expiring Sept. 19.
Transocean (RIG)
An American drilling company, Transocean (RIG) is the world’s largest offshore drilling contractor based on revenue. Given that RIG stock trades hands for a little over three bucks, it’s easily the riskiest idea on this list. Moreover, on a year-to-date basis, RIG lost more than 17%. In the past 52 weeks, it’s down more than 40%. It’s wildly volatile but that’s also where the opportunity could be.
In the past 10 weeks, the market voted to buy RIG stock six times and sell four times. During this period, RIG enjoyed an upward bias. Following the earlier logic, we’ll label this sequence as 6-4-U. On a rolling basis since January 2019, this pattern has materialized 35 times.
As you might imagine, what makes RIG stock particularly risky is its negative bias. On any given week, the chance that a long position will be profitable is only 48.12%. That’s not good. However, with the 6-4-U sequence, the odds improve to 57.14%.
True, that’s not exactly earth-shattering. However, the median expected performance assuming the positive pathway is 6.69%. Further, if the bulls can hold on for the next five weeks, speculators may anticipate an additional 3.08% of performance. Therefore, the upside target for RIG stock would be around $3.41.
As such, I’m intrigued by the 3.00/3.50 bull call spread expiring Sep. 19. With a little luck, RIG stock could potentially hit the short strike price. Otherwise, the breakeven point for this trade is $3.22, which is a realistic target.
On the date of publication, Josh Enomoto did not have (either directly or indirectly) positions in any of the securities mentioned in this article. All information and data in this article is solely for informational purposes. For more information please view the Barchart Disclosure Policy here.